Pivotal View
OBJECTIVE
The Pivotal View function is used to examine maestro* data quickly and easily, in the form of a dynamic cross-reference table or graph.
Steps
Analyzing data using pivotal view
- Consult the various audit tools:
These tools are used to perform reminder, save, delete, export, import and print operations.

- The Display or Hide Available Fields icon is used to display or hide the fields available for analysis.
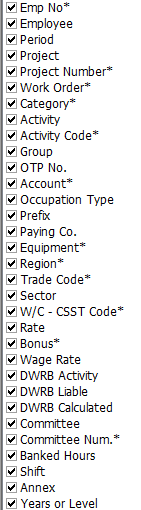
When you have made your choice, click on Accept.
- The Template field is used to assign a name to a display format created by the user and the Save this Template icon saves it.
A saved template only displays the column definition and language in which the template was saved.
A template can be available to all users or only the user who created it. The system asks whether you want to share.
- The Delete this Template icon deletes the template from the list.
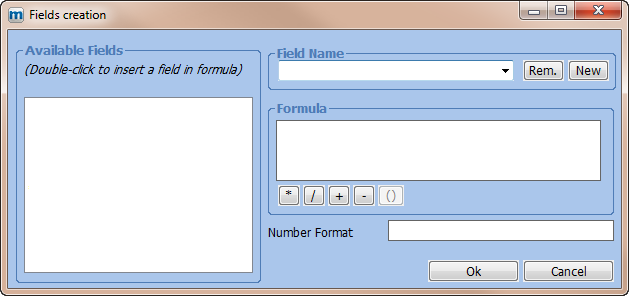
- The Calculated Fields icon provides access to a configuration screen used to configure new fields based on existing fields.
Only Number type fields can be calculated.
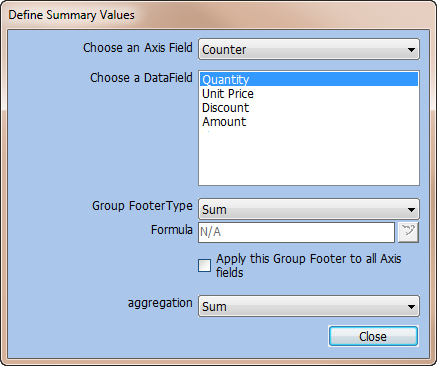
- The Define Totals icon defines how totals in each section will be calculated.
- The Transfer to Excel icon transfers the displayed data to Excel. The data is transferred based on the display configurations in effect.
- The View Data in Graph Mode icon changes the display so that data can be viewed as a graph.
- The Report Configuration icon provides access to print configurations used to create the header to be printed on the report.
- The Import Display Format and Export Display Format icons are used to import or export the analysis formats.
- The Print Preview icon is used to view the report on the screen before it is printed.
- The Print this Template icon prints the analysis displayed on the screen.
- The Display or Hide Available Data Fields icon is used to display or hide the list of available analysis fields.
- Move the available fields based on specific requirements.

These fields are available for three functions:
- To be used as a group field by dragging them to the desired location in the table.
To position a field, go to the desired field and click the left mouse button while holding it down. Drag the field to the desired location. Arrows indicate where the field will be placed. Release the button to free the field.
- To apply a filter.
To create a filter, click on the arrow to the right of the field to which the filter is to be applied.

- The + symbol is used to select all choices with a single click.
- – symbol is used to clear all choices with a single click.
- * symbol is used to reverse all choices with a single click.
- The √ symbol confirms the choices.
- The X symbol cancels the operation.
- Used as a page field (such as Project). This section is above the available fields.
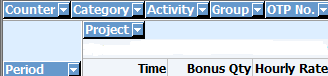
These fields separate the analysis fields into different parts. Multiple fields can be placed in this section. The data will be grouped according to the order of the selected fields.
- Determine the display of data based on specific requirements.
These fields form the structure of the analysis. If you move them, the way in which you view the data changes.
You can obtain totals for any group.
Each section can be summarized by clicking on the – symbol to the left of each item.

- Display the analysis fields based on specific requirements.
To position a field, go to the desired field and click the left mouse button while holding it down. Drag the field to the desired location. The arrows indicate where the field will be placed. Release the button to free the field.
- Click the right mouse button in a blue field to perform certain operations.
Field
Description
Activity
Represents the current section and changes based on the column in which the cursor is located.
Define Totals
Used to change the configuration of total lines.
Hide Totals in this Section
Allows you to hide totals in the section.
Hide all Totals and Display all Totals
Allows you to hide or display totals in all sections.
Insert Calculated Columns
Used to create new analysis fields.
Print Preview
Used to view the results before printing.
See also